

Every day, a vast amount of data points are being recorded at your school, but how much of it is going to waste? This data could be used to spark change, but only if you're able to interpret and analyse what it's trying to tell you.
In today's world, ensuring staff have a high level of data literacy is vital for your student's success. So, what is data literacy?
The Department of Education Queensland defines data literacy as "the knowledge, skills and dispositions to use data ethically to inform policies, decisions and practices."
Put more simply, data literacy is the ability to use data to make informed decisions. With this in mind, let's take a look at the importance of data literacy in schools and how you can assess and improve your overall data literacy levels.
The Importance of Data Literacy in Schools
Utilising data is imperative to the success of your student's learning and well-being, and in order to do so you must first be able to interpret it. AISNSW states that:
"When educators are able to collect and effectively analyse data to guide their educational decisions, they become more effective in reviewing students' existing capacities, identifying areas for growth, and developing plans for student improvement."
However, many educators feel inadequate when it comes to analysing and understanding data. Given this, assessing the data literacy levels across your school, and implementing methods of improving them is vital.
How to assess data literacy
Without data literacy, data storytelling and visualisation are not possible, so ensuring where you and your team sit in terms of data literacy is essential.
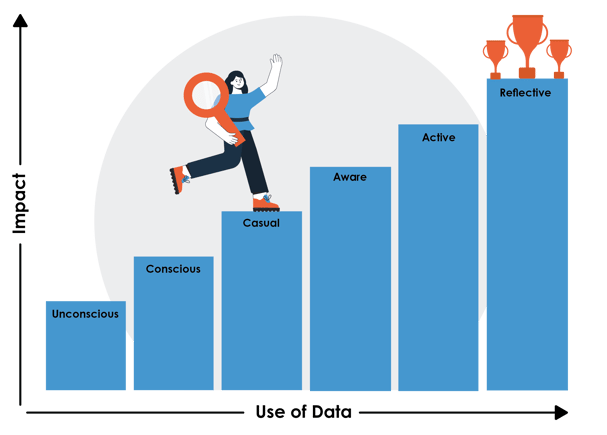
In her book "I'm Not a Numbers Person", former teacher and data expert Dr Selena Fisk has put together a six-level system to assess the current data literacy levels across your school.
- Unconscious
The first level of this system refers to unconscious data users. People in this category are usually unaware of the data that surrounds them day-to-day.
- Conscious
People in this category are usually aware that data exists but have limited knowledge of what it means. With a limited understanding of data, users in this category are typically uncertain of data or have negative connotations towards it.
- Casual
This category refers to people who may be able to understand the importance of data, but lack the skills to interpret and utilise it. Casual data users are also at the stage where they know they need to start learning more about data.
- Aware
People in this stage have taken the time to learn more about the data surrounding them and know why it is essential.
- Active
Active users can read and decipher the data around them and are beginning to look at how change can be deployed based on the evidence it provides.
- Reflective
While reflective users are at the top of this list, they are still reflecting on improving their processes and understanding data further. Reflective users actively participate in the data analysis cycle, interpreting data to produce change, which provides new data for them to reflect on, resulting in ongoing refinements.
While Dr Selena Fisk has condensed data learning into six levels, as shown above, it is important to know that this is not an overnight process. Expanding your data interpretation skills will take extensive learning and refinement.
Many different online resources are available to test your data literacy levels. The Data Literacy Project is an initiative focused on improving the data literacy levels of people across the globe. They offer a multitude of online tools to not only improve your data literacy but free online quizzes to get a better understanding of your current ability with data literacy.
How to improve data literacy
In a world overflowing with data, data literacy is becoming an expectation for many workplaces, and education is no exception.
With schools recording data on attendance, internal and external assessments, pastoral care, well-being, and extracurricular, just to name a few, staying ahead of the curve when it comes to data literacy is vital to ensure you can interpret and decipher information and then apply it to spark change. This will better support your students and make sure no one slips through the cracks.
With more and more organisations understanding the importance of data analytics, the resources needed to become a data detective have become much more accessible. In light of this, below are some options you can utilise to improve your own data literacy or that of your school community.
Online Courses
Online institutions and universities now offer various short-term or part-time courses to improve your understanding of data literacy and analytics. Prevalent Australian institutions such as UNSW, QUT, and RMIT, among others, offer classes ranging from quick three-hour sessions to more extensive six-month courses.
Getting Hands-On with Data:
As already established, schools record a tremendous amount of data and getting your hands dirty is a sure-fire way of garnering a better understanding. Joining in conversations, asking questions, and collaborating with your colleagues are all methods you can utilise to become more familiar with the data at your school. Taking the knowledge you have gathered and applying it to your classroom, to find out what does or doesn't work will set you firmly on the path towards becoming a more data-savvy educator.
Analytics Solutions to bridge data literacy gaps:
To make it easier for beginners and experts to gain insights from data, an analytics solution can handle the heavy lifting, and even the playing field for data-users across your school. A dedicated software solution (such as TrackOne Studio's Leaning Analytics Suite) takes care of the consolidation of data and number crunching for you, allowing you to focus on drawing insights and actioning them. Software vendors like this will also typically offer best-practice training and assistance to ensure you are getting the most out of their system.
How to improve whole school data literacy
Ensuring staff can decipher and make conclusions based on the data already at your school is vital for your student's success. According to the School of Education, teachers that use data literacy to assess students and lessons will see an increase in student learning and understanding.
Where to start?
If you are simply glancing at the data being recorded at your school and then storing this information in a graveyard of spreadsheets, you are only doing half the job.
Instead, ask the question “how could your school turn the data it records into easy-to-digest insights and visualisations for your educators?”
In her book "I'm Not a Numbers Person", Dr Selena Fisk discusses the countless schools she has worked with that record large data sets, but whose teachers simply do not know how to action data.
Having identified this problem, she has put together five key steps to assist with the initial approach to looking at data:
- Recognise unique lenses
- Everyone will approach data from a different perspective, highlighting other areas for analysis.
- Use multiple data sets
- To get a comprehensive picture, broadening your horizons and not pigeonholing on a single data set is vital.
- Analyse data by zooming in and out
- Similar to the above, expanding or narrowing your field of view will assist in interpreting data.
- Cut out the white noise
- Zooming in and out will also make it easier to tell what data may be less relevant, so less time is spent on analysing unnecessary data points.
- Try to minimise errors in thinking
- Try to keep an open mind when reading data, as preconceived biases can result in incorrect interpretations.
Utilising these critical principles as building blocks for data storytelling will allow you to begin determining trends in the data.
Telling a story with your data
An effective way of driving change with the data trends you find is by using data storytelling. Catherine Cote for the Harvard Business School states that:
"Data storytelling is the ability to effectively communicate insights from a dataset using narratives and visualisations. It can be used to put data insights into context for, and inspire action from, your audience."
Without effectively communicating the data collected to others, deploying change will be a challenging task. Delving deeper, there are two things to consider to ensure you share your data findings effectively.
- Build a Narrative
Just like a fictional tale, giving your data analysis a clear narrative structure will make it easier for the audience to follow and understand.
With an introduction, evidence of issues, climax and resolution, your audience will get a more rounded view of the story the data is telling, and a better understanding of your findings and proposed actions or next steps.
- Back up your findings with Visualisations
To better illuminate your findings and narrative, graphics, graphs, and other visualisations will provide context to the information you are trying to convey, and be easier to process your audience, especially if they are just starting their data analysis journey.
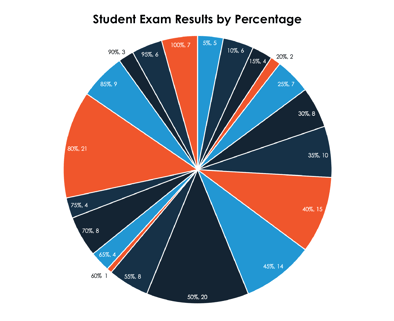
When deciding on these visuals, ensure that the graph or graphic suits the level and amount of data you're displaying, or you may risk making things more complicated. For graphs, a good rule of thumb is that if you have to label each data point with the figure it represents, it's probably not the best visualisation.
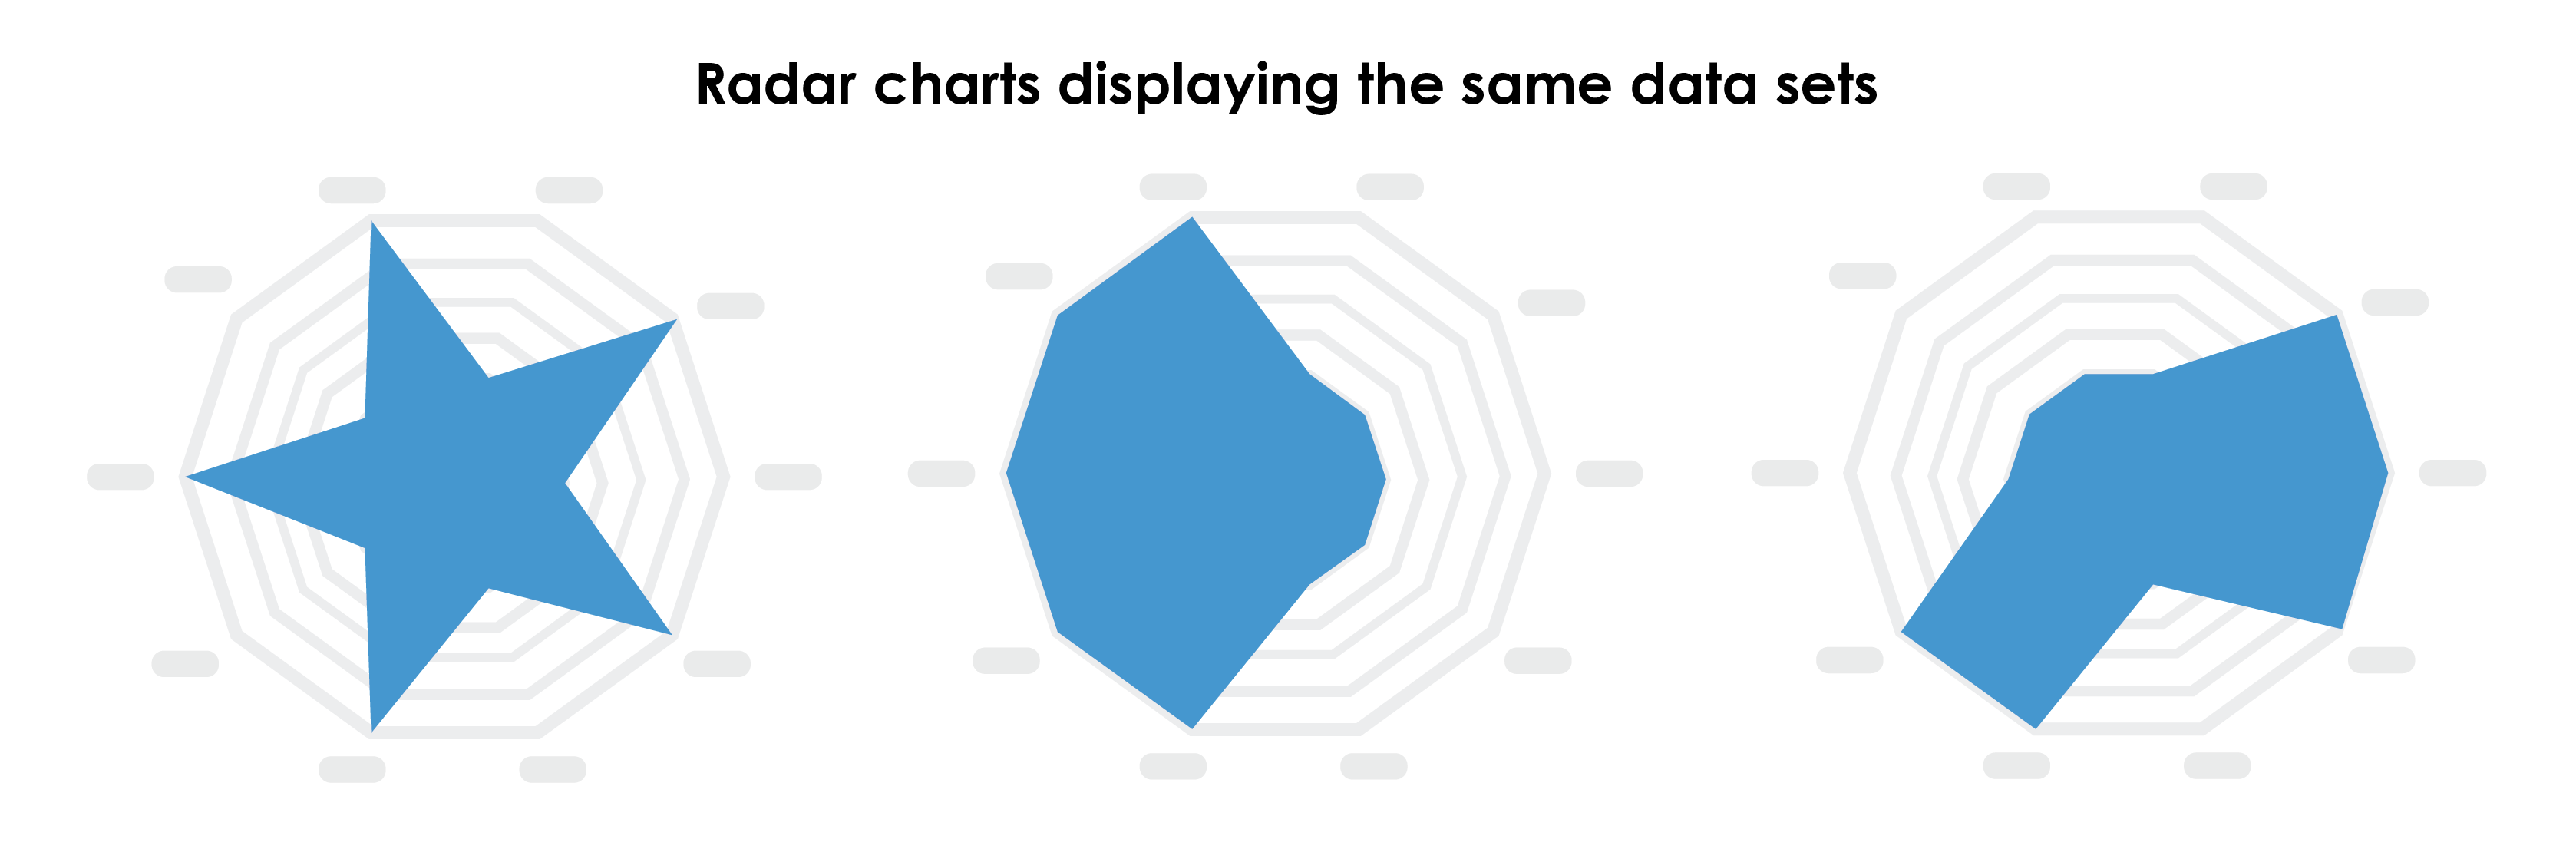 Some examples of visualisations that are difficult to consume.
When reviewing your visualisations, ask yourself the following questions:
- Does the visualisation have a purpose?
- Can it be easily understood?
- Does the visualisation set you up to implement change?
As outlined, there is a lot to consider when establishing data trends and presenting your findings to your team in the hopes of actioning change; however, this is not possible if you and your team are not up to scratch in data literacy.
Don't be discouraged if you're at the beginning stages of data awareness. No one is born an innate data expert, but getting your hands dirty and getting involved with the data at your school is bound to turn you into a data-savvy educator which will guarantee the success of your school and your students.